Retina
Every Cell has a Story to Tell.
Let’s Discover Yours
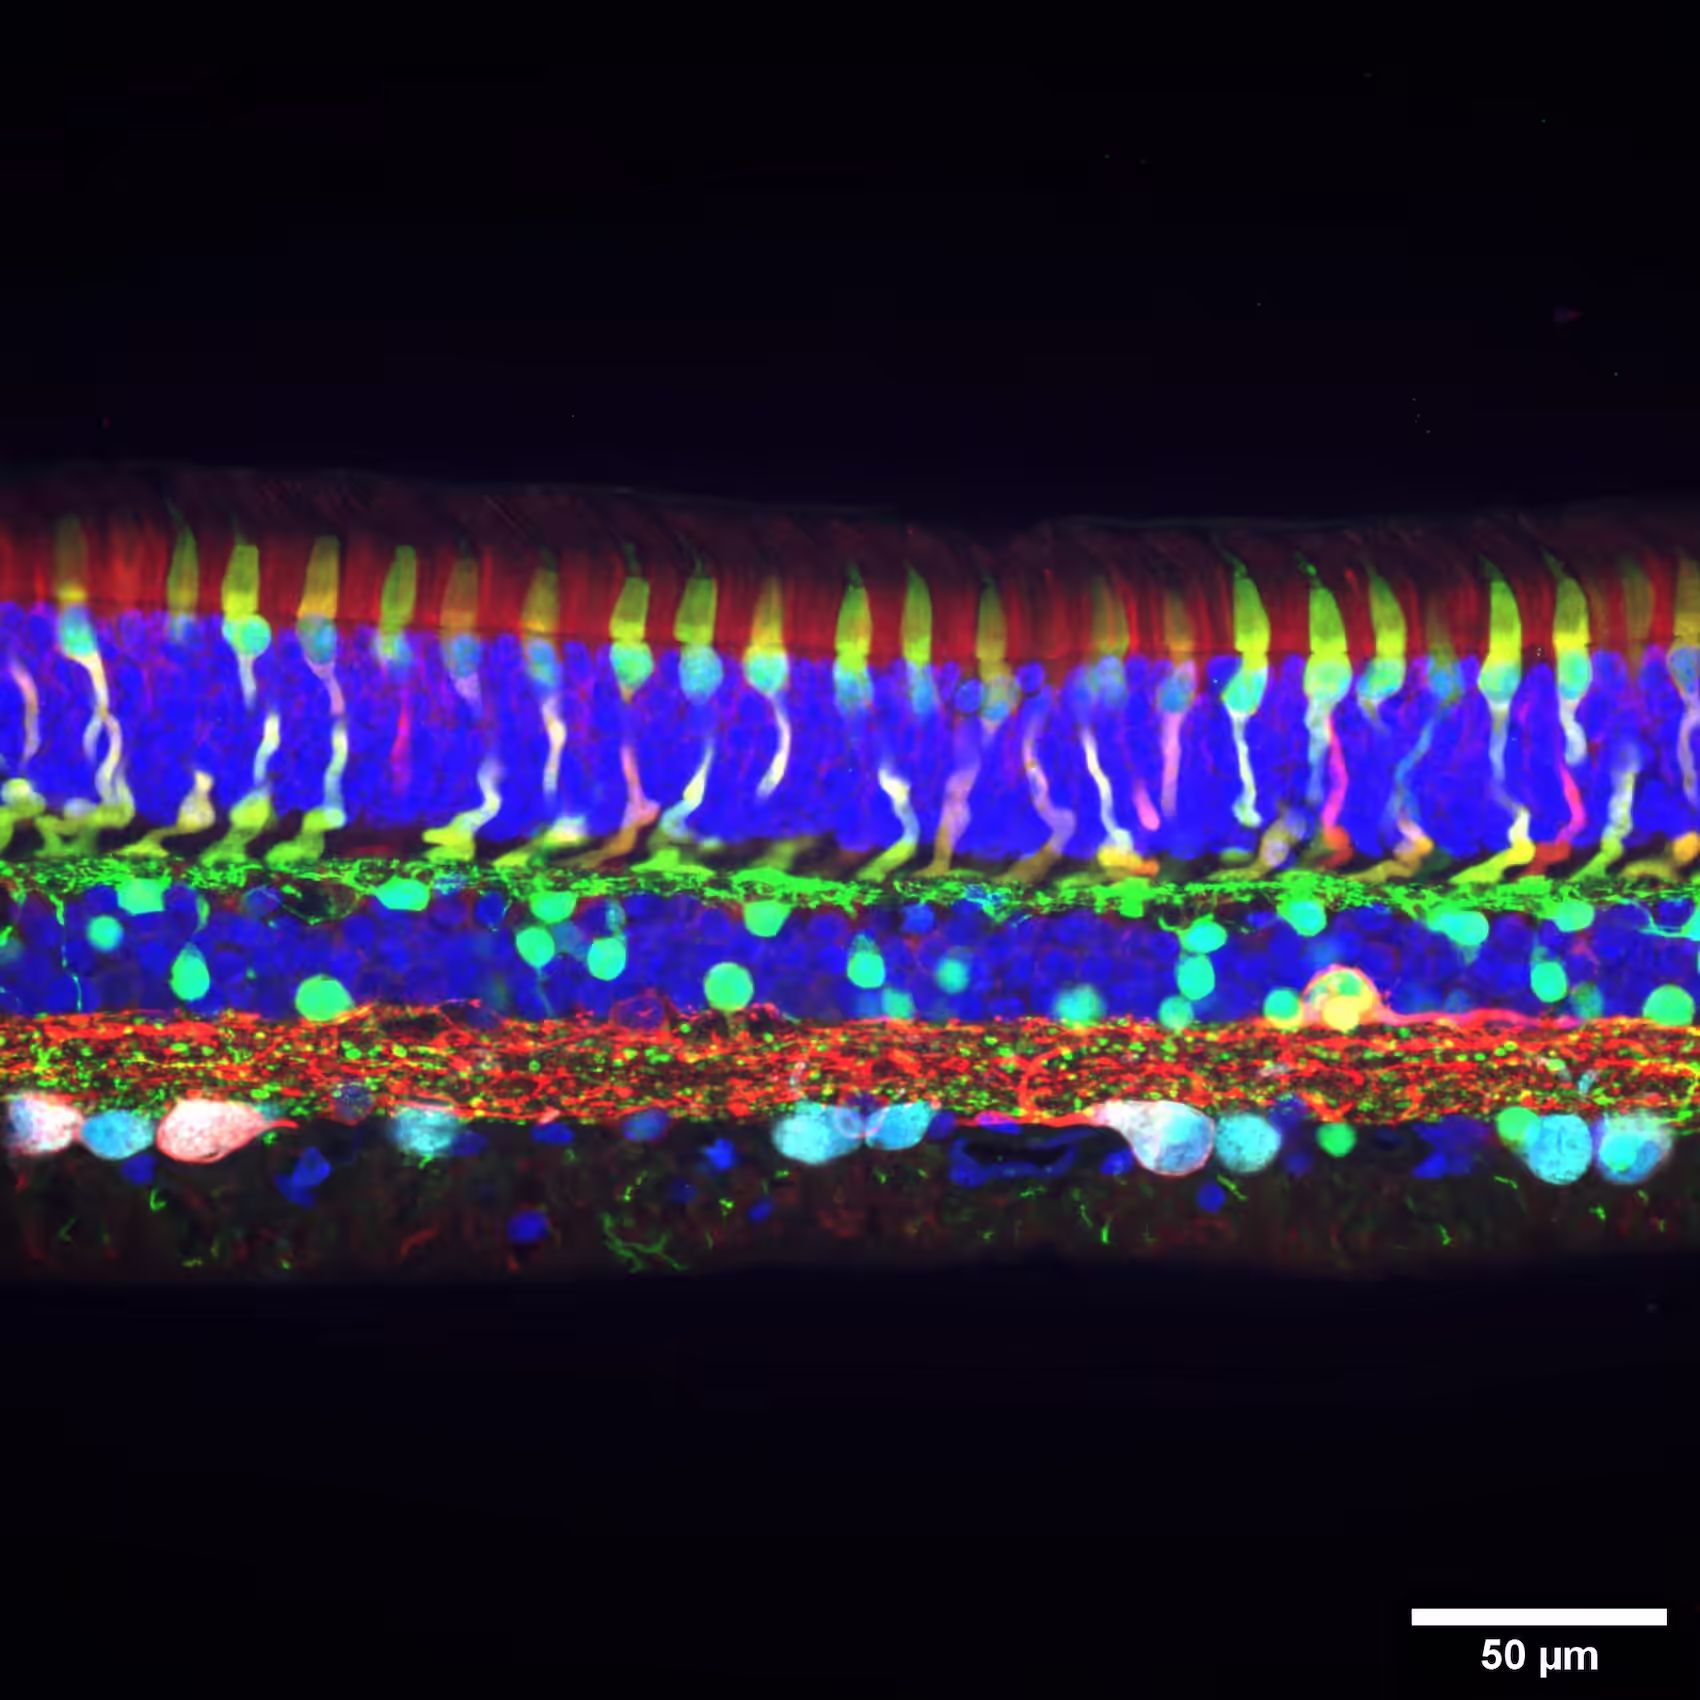
Retina explants offer a physiologically relevant ex vivo model to study visual processing and disease mechanisms. Electrophysiological recordings from sparse retinal ganglion cells (RGCs) reveal functional output of the entire retinal circuit, from photoreceptor input to signal transmission.
Our High-Density Microelectrode Array (HD-MEA) technology provides the density and resolution needed to reliably capture RGC activity and decode visual responses with precision, using supported light stimulation setups and reproducible workflows.
From retinal circuits to single cell precision
Capture high-quality neuronal signals with unmatched single-cell resolution and low noise, enabling detection of even the smallest RGC spikes and decoding of population-level visual processing from photoreceptor input to retinal output.
Capture RGCs with confidence
RGCs drive visual output yet represent only around 1–2% of retinal cells. Reliably capture RGC activity across the whole explant and distinguish functional phenotypes with confidence, thanks to our ultra high-resolution readouts.
Track signal propagation along axons
Follow signal propagation along axonal paths to dissect how visual information is transmitted, acquiring reliable action potential from even the tiniest signals.
Easily integrate light stimulation for effortless functional characterization
Functionally characterize photoreceptor response using precisely controlled light stimuli with our commercialized setup and HD-MEA technology, optimized to reduce optical artifacts while preserving signal quality.
Case studies

Spontaneous electrical activity across the whole retina
The sensing area of the MaxOne Single-Well and MaxTwo Multi-Well HD-MEA Systems covers a significant portion of the rodent retina, enabling high-resolution functional mapping of retinal activity. Shown here are heatmaps of spontaneous activity from a representative freshly dissected retina explant.
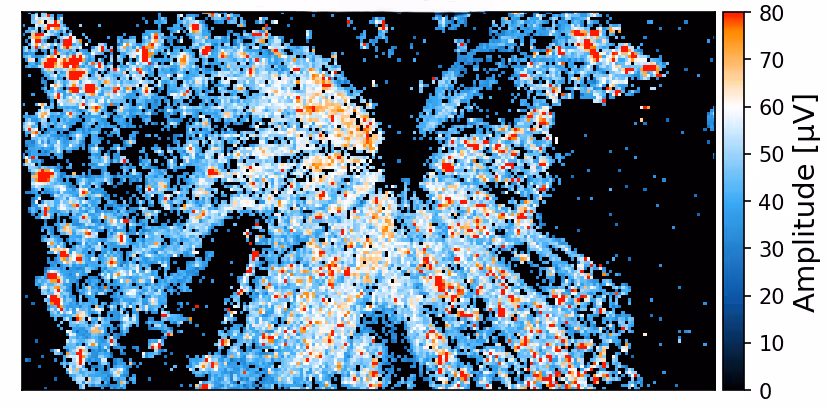
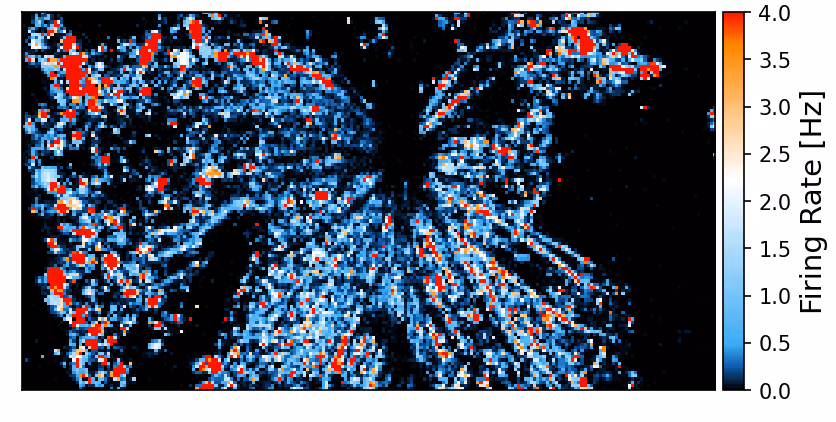
Spontaneous RGC activity across the whole mouse retina explant.
RGC activity was recorded from isolated retinas of C57BL/6 mice at a pre-symptomatic phase of the experimental autoimmune encephalomyelitis (EAE) model of multiple sclerosis. A CFA (complete Freund’s adjuvant)-treated control retina explant was placed RGC-side down on a MaxOne HD-MEA Chip and gently held in place using the MaxOne Tissue Holder, with optic disc and peripheral regions preserved to maintain axonal integrity. Spike amplitude (top) and firing rate (bottom) maps obtained with the ActivityScan Assay illustrates spontaneous RGC spiking across the preparation.
Courtesy of Dr. Filippo Galluzzi, Italian Institute of Technology, Genoa, Italy.
Classification of RGC based on light-stimulation
Identify and functionally dissect specific RGC populations, based on their light-evoked response, thanks to our high-resolution HD-MEA technology. In this example, four populations of RGCs are highlighted, each with a unique response profile to the light stimulus provided, illustrating the precision and discriminative power of the platform.
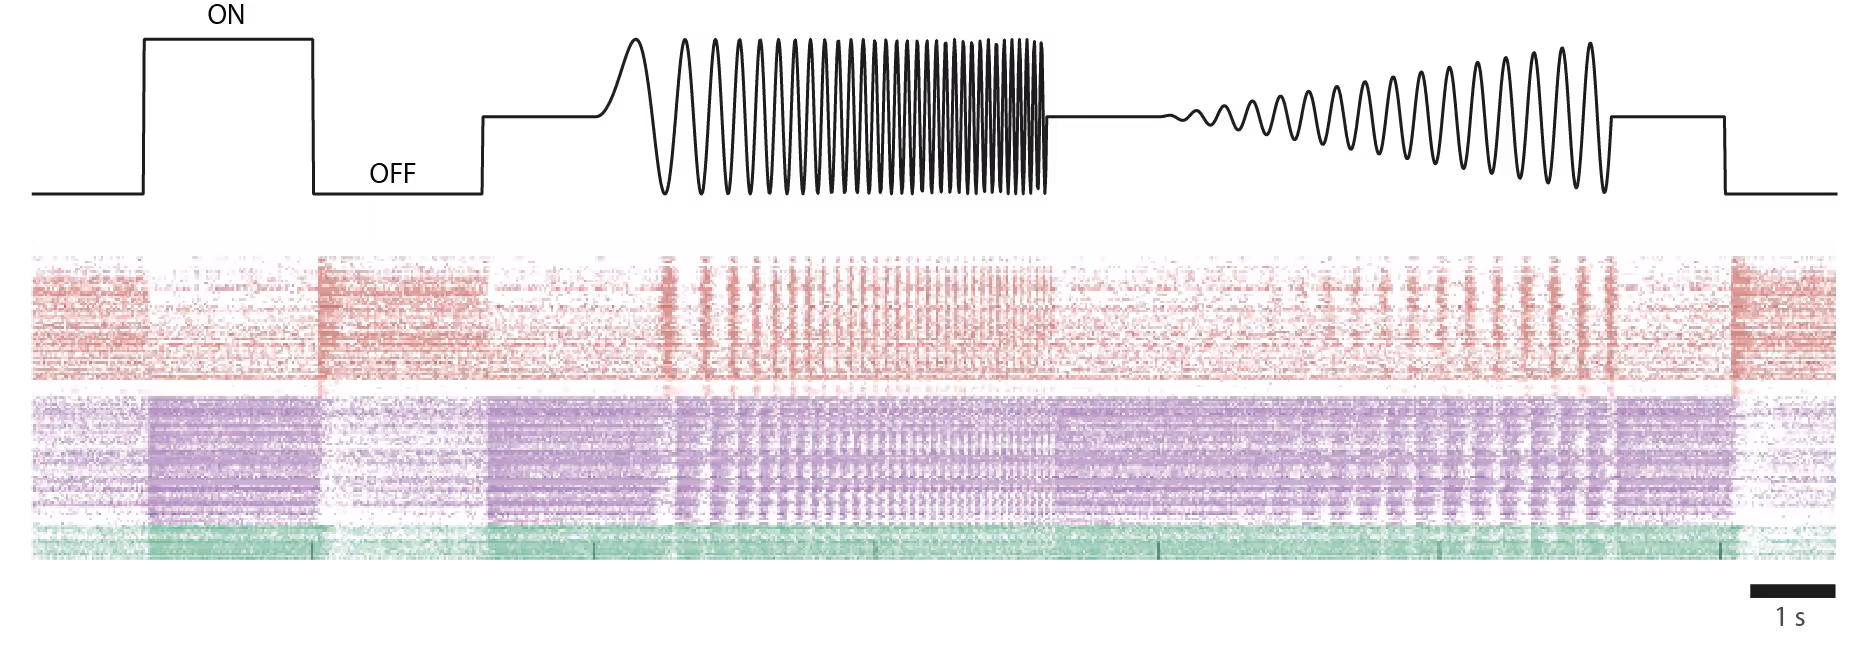

Response to light stimulus of individual foveal RGCs in an ex-vivo human retina from a donor.
Top: Temporally modulated full-field ON/OFF contrast light stimulus used to probe RGC responses.
Bottom: Raster plot showing light-evoked spike responses from individual foveal RGCs. Each row represents a single neuron; each dot marks an action potential. RGCs were functionally classified based on their temporal firing pattern following light stimulation. Cells are grouped and color-coded by response type, reflecting their functional diversity.
Courtesy of Dr. Annalisa Bucci, postdoctoral researcher in the Quantitative Visual Physiology Group led by Dr. Felix Franke at the Institute of Molecular and Clinical Ophthalmology Basel (IOB)
Label-free reconstruction of RGCs and their axons
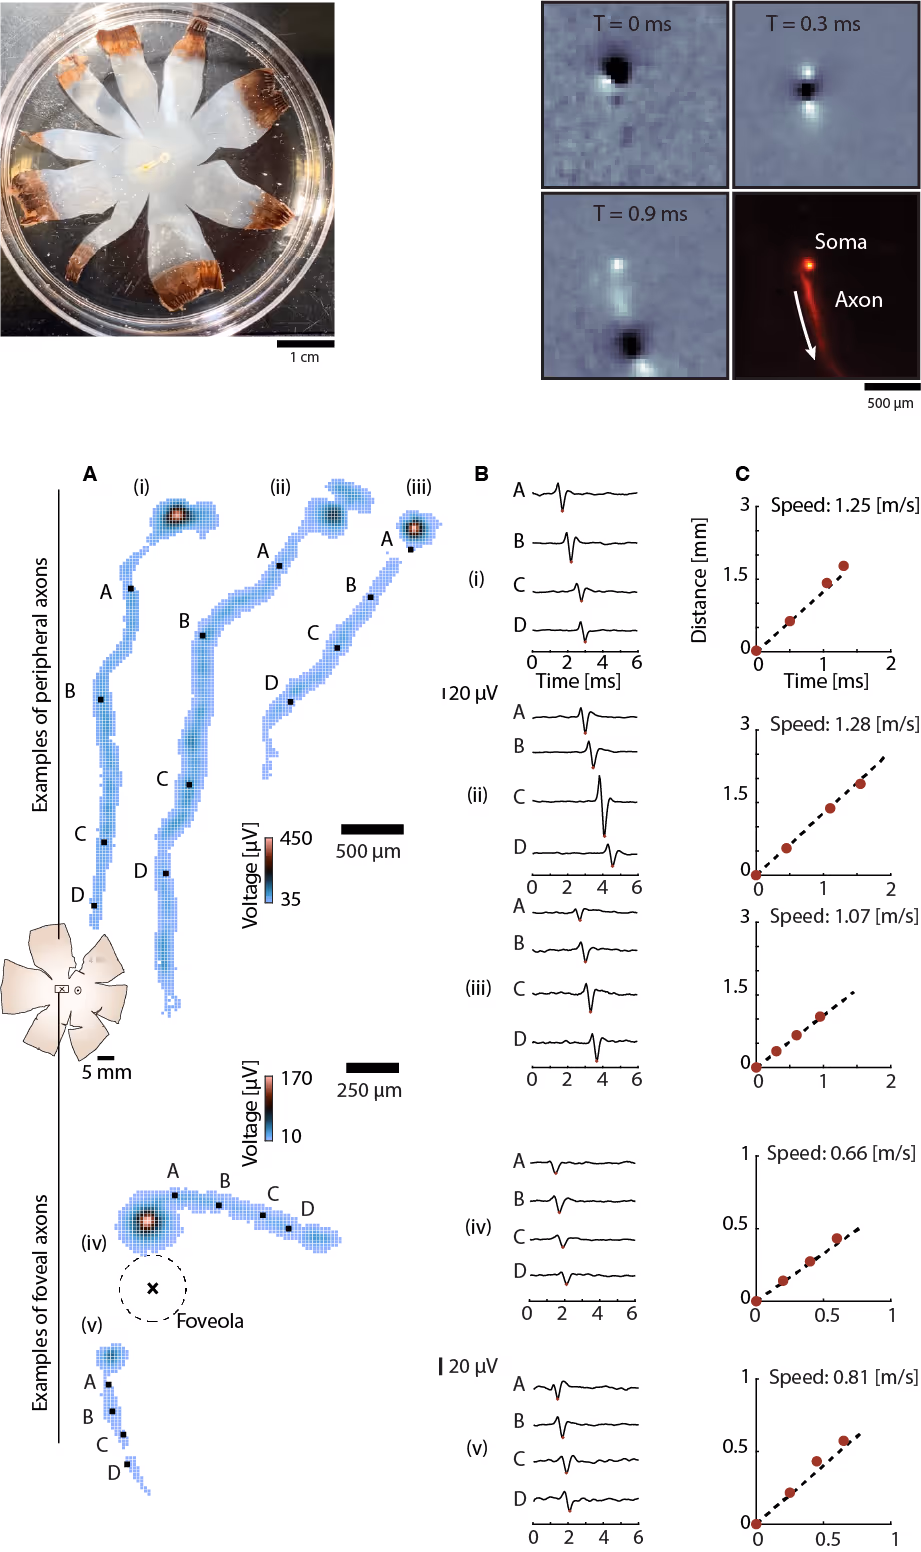
Reconstruct the electrical morphology of retinal ganglion cells and investigate their structural and functional features within a single experiment. Representative RGC from different retinal regions are shown with reconstructed axonal trajectories and quantified action potential propagation speeds, enabled by the subcellular resolution of our HD-MEA technology.
Tracking axonal action potential propagation in RGCs
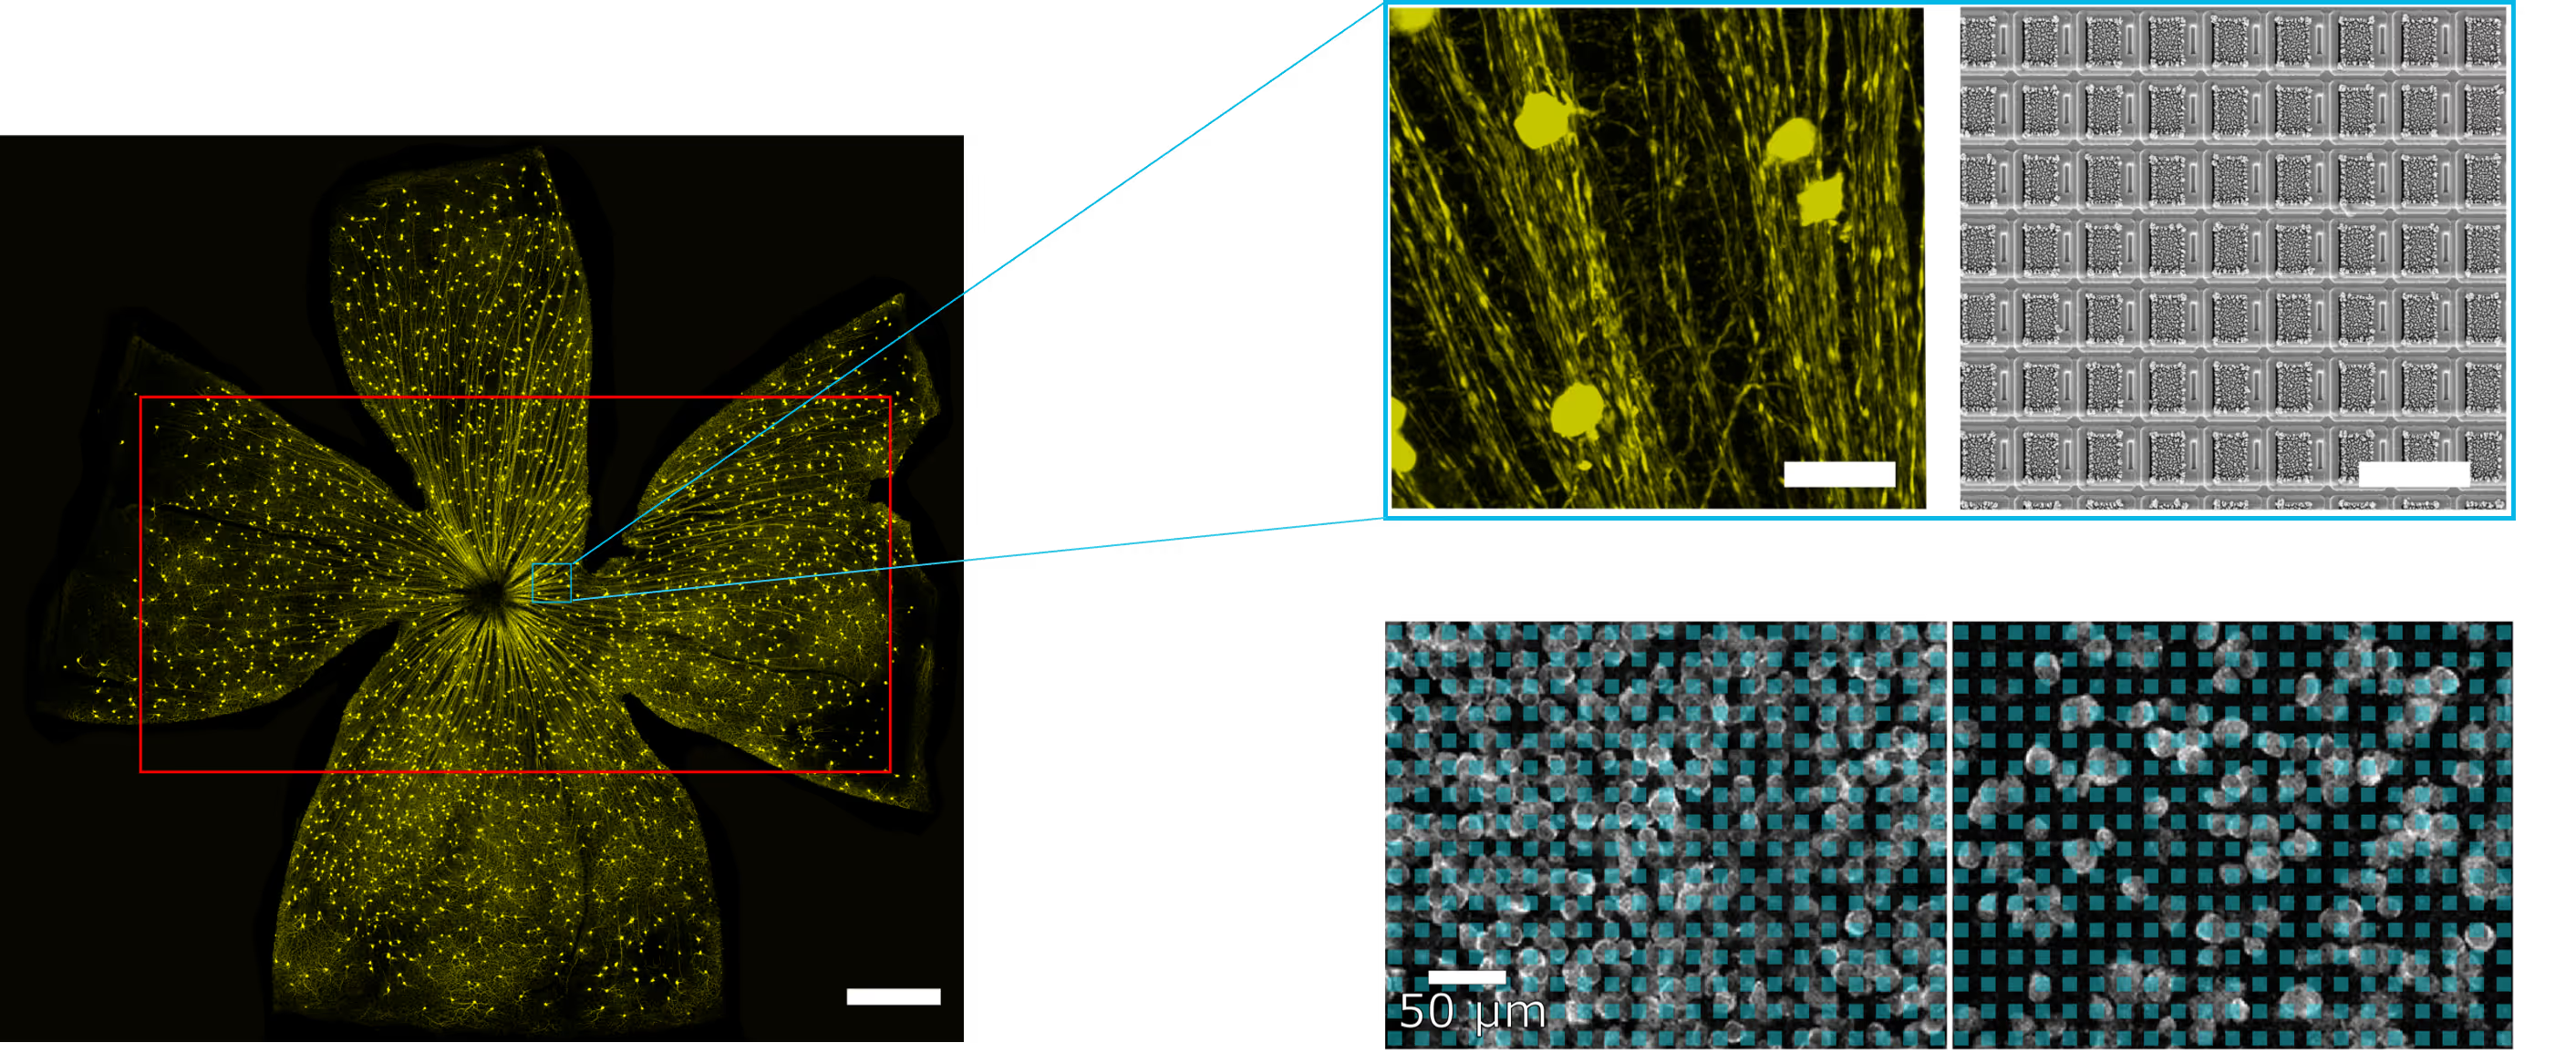
Top: (Left) Human retina isolated and flattened post-enucleation. (Right) Successive frames show action potential traveling along an exemplary axon across the electrode array. The aggregated frames yield the spatial profile of the average action potential waveform along the axonal trajectory.
Bottom: (A) Electrical images of representative RGC axons from peripheral (top) and foveal (bottom) regions. Peripheral RGC axons project toward the optic disc in near-linear paths, while foveal RGC axons follow curved trajectories around the foveola. Colored squares indicate electrodes detecting action potentials, with color denoting voltage amplitude. (B) Average action potential waveforms recorded at increasing distances from the soma at the selected sites shown in A as black squares. (C) Axonal action potential propagation speed for the different RGCs in A.
Courtesy of Dr. Annalisa Bucci, postdoctoral researcher in the Quantitative Visual Physiology Group led by Dr. Felix Franke at the Institute of Molecular and Clinical Ophthalmology Basel (IOB).
Related to this topic: Bucci et al., Nature Neuroscience, 2025.
Selected Resources
Synchronization of visual perception within the human fovea

High-density Multielectrode Array Recordings of Retinal Waves Using An Electrophysiology Platform

Tellurium nanowire retinal nanoprosthesis improves vision in models of blindness

Solid-State Nanopores for Spatially Resolved Chemical Neuromodulation

Cell Types of the Human Retina and Its Organoids at Single-Cell Resolution

MaxOne Digital Input Extension Board Instructions
User guide for setting up the Digital Input Extension Board (DigiPins) to synchronize external events with MaxOne recordings using Python scripts.
Retina Application Brochure
Relevant
Applications
Relevant Biological Models
.avif)
Dr. Elisabetta Colombo
“Considering the current limitations in retinal prosthetics, the ultra-dense electrode layout of the system enables high-resolution spatial mapping. This allows us to assess the spatial selectivity of the stimulation platform under evaluation. The dense electrode configuration, combined with the availability of a dedicated assay to track action potential propagation, has been crucial in providing insight into axonal conduction velocity.”