Functional Phenotyping
Every Cell has a Story to Tell.
Let’s Discover Yours
Functional phenotyping is the quantitative assessment of cellular activity, particularly electrophysiological function, used to characterize cell behavior beyond morphology or molecular and genetic identity.
In neuroscience and stem cell biology, it involves capturing the dynamics of neuronal function, including how neurons generate and propagate action potentials, form synaptic connections, and engage in coordinated network activity over time.
By measuring both spontaneous and evoked activity at single-cell and network levels, functional phenotyping provides critical insights into neuronal maturation, connectivity, and physiological relevance. These dynamic functional readouts complement imaging and transcriptomic profiling, offering a more comprehensive understanding of neuronal identity and behavior.
MaxWell Biosystems’ HD-MEA platforms offer a powerful approach to functional phenotyping, capturing rich, multidimensional data beyond basic firing rates. With ultra high-resolution, label-free recordings of neuronal activity from subcellular events to large-scale networks, our HD-MEAs allow scientists to reveal the full story encoded in their biological models.

Achieve highly reproducible network readouts
Network bursting activity provides insights into neuronal maturation and connectivity. Reproducibility across wells, batches, and timepoints gives researchers confidence that their observations reflect true biology, not technical noise or variability caused by limited coverage in each well.
Track axons in detail for deeper insights
Different cell types and maturation stages show distinct axonal morphologies and conduction velocities. Detailed axon tracking enriches cell classification and enables researchers to assess how efficiently and precisely neurons communicate.
Detect subtle signals early
Early-stage neuronal cultures and 3D models like organoids can exhibit weak, sparse signals. Detecting these subtle events is key to tracking the onset of excitability, connectivity, and functional maturation. Reliable detection of low-amplitude activity also supports comprehensive, longitudinal tracking of functional changes.
Scale with confidence
For large-scale studies with diverse cell lines and models, automation ensures consistent data acquisition, processing, and analysis across wells and timepoints. Our automation-ready HD-MEAs streamline workflows, accelerates data turnaround, and enables scientists to quickly evaluate and interpret phenotypes.
Case studies

Electrophysiological Profiling of hiPSC-Derived Neuronal Cell Lines
This study used HD-MEA technology to characterize the functional development of human iPSC-derived motor and dopaminergic neurons (iCell® DopaNeurons, iCell® Motor Neurons, iCell® Astrocytes, FUJIFILM Cellular Dynamics International, Madison, USA). Recordings captured the maturation of spontaneous firing and network activity over multiple time points. Network activity recordings revealed distinct oscillation patterns for each neuronal culture, demonstrating highly sensitive functional phenotyping of different cell lines, even at early developmental stages. Read more in Ronchi et al., Adv. Biol., 2021.
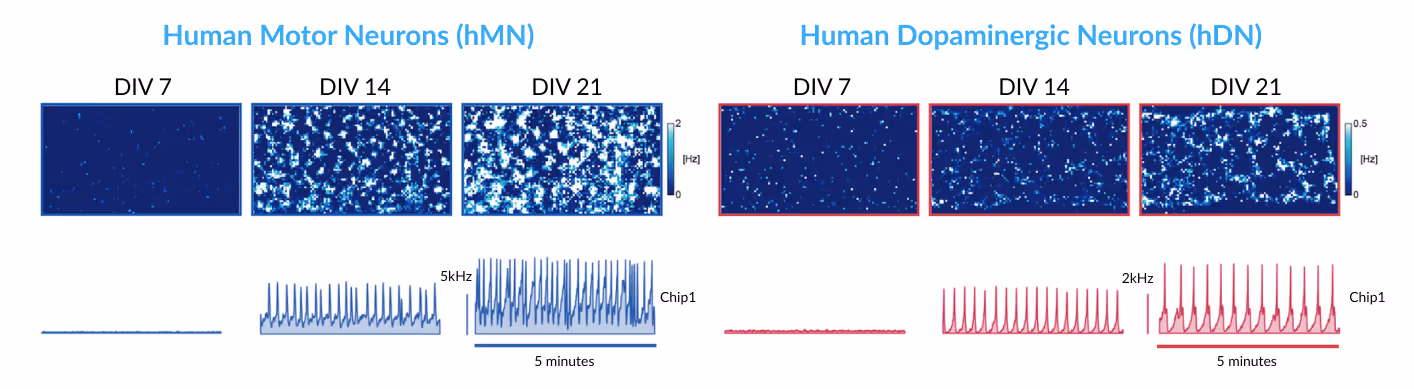

Electrophysiological phenotyping of human iPSC-derived neurons
Top: 2D spatial distribution maps of firing rates for motor neurons (left) and dopaminergic neurons (right) at DIVs 7, 14, 21, respectively.
Bottom: Network activity, depicted as population spike time histograms, of motor neurons (left) and dopaminergic neurons (right) at DIVs 7, 14, 21, respectively.
Data adapted from Ronchi et al., Advanced Biology, 2021.
Axonal Tracking and Maturation in Neuronal Cultures
This study reveals the functional development of axons in a co-culture of NeuCyte SynFire iNs (glutamatergic and GABAergic neurons), capturing the growth and increasing complexity of neuronal networks across distinct maturation stages. High-resolution activity scans and axonal developmental trajectories reveal the emergence of intricate neuronal arborization and progressive increase in action potential conduction velocity. These analyses enable researchers to distinguish cell types and monitor functional interconnections from the network level down to subcellular resolution. By capturing these subtle yet critical changes, our platform provides unique insights into neuronal communication and maturation that are essential for advanced cell classification and functional phenotyping.
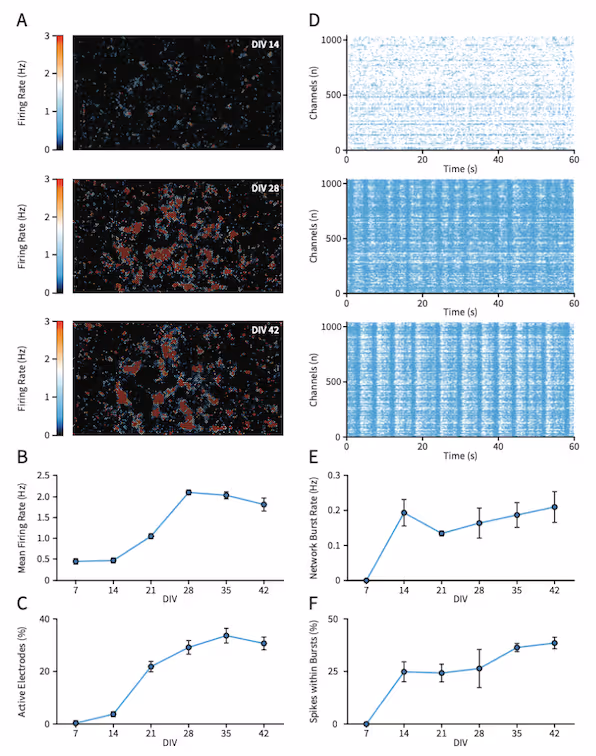
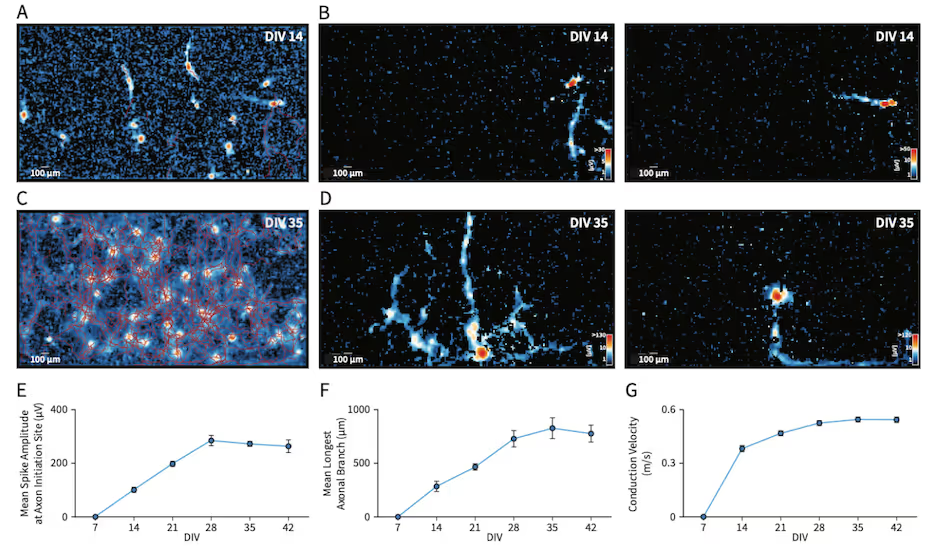
Functional Maturation and Axon Development in NeuCyte SynFire iN Co-Cultures
Top: ActivityScan Assay firing rate heatmaps (A) and Network Assay raster plots (D) tracking the development of spontaneous, synchronous network activity in SynFire iN co-cultures at DIV 14, 28 and 42. Longitudinal quantification of mean firing rate (B), percentage of active electrodes (C), network burst rate (E) and spikes within bursts (F).
Bottom: AxonTracking Assay maps of the entire well (A,C) and representative neurons and their axonal branches (B,D) at DIV 14 and 35. Quantification reveals functional maturation of axonal branches, including spike amplitude at initiation site (E), axonal length (F) and conduction velocity (G) longitudinally. Data represents mean ± standard error of the mean.
Data adapted from the Application Note in collaboration with NeuCyte, Inc., USA.
Reproducible and scalable functional profiling of human iPSC-derived neurons
This study illustrates the highly reproducible functional profiling of Quick-Neuron™ human excitatory iPSC-derived neurons cultured on the MaxTwo Multi-Well HD-MEA System. Consistent longitudinal recordings across independent wells reveal reliable measures of spontaneous firing activity, network bursting, and axonal trajectories. By capturing robust phenotypic metrics across replicates and timepoints, our platform enables scientists to confidently identify true biological mechanisms, not technical noise, while supporting scalable studies in diverse neuronal in vitro models.

Network Dynamics and Axonal Properties of Elixirgen Scientific’s Quick-Neuron™ Excitatory - Human iPSC-derived Neurons
Top: ActivityScan Assay firing rate heatmaps (A), Network Assay raster plots (B) and network activity (C) profiles capture increasing spontaneous activity and network synchrony over time in human iPSC-derived excitatory neurons.
Center: Longitudinal quantification of active electrode percentage (A), network bursts per minute (B), spikes per burst (C) and burst peak firing rate (D) in two wells.
Bottom: AxonTracking Assay maps visualize action potential amplitudes and axonal branching at DIV 63 and 83 (left). Time course of average axonal length and conduction velocity measured across independent wells (right).
Data adapted from the Application Note in collaboration with Elixirgen Scientific.
Selected Resources
Human neuron subtype programming via single-cell transcriptome-coupled patterning screens

Dendritic spine formation and synapse maturation in transcription factor-induced human iPSC-derived neurons

Generation of functional posterior spinal motor neurons from hPSCs-derived human spinal cord neural progenitor cells

Long-term morphological and functional dynamics of human stem cell-derived neuronal networks on high-density micro-electrode arrays

Functional neuronal circuitry and oscillatory dynamics in human brain organoids

Long-Term High-Density Extracellular Recordings Enable Studies of Muscle Cell Physiology

Relevant
Applications
Relevant Biological Models

Prof. Yoshiho Ikeuchi
“Today, our MaxOne System plays a central role in our work. In fact, it has become a defining element of our research. It allows us to grow organoid-derived neural networks directly on the array surface and record their activity over long periods. This enables us to observe temporal-spatial dynamics, correlations, and sequential patterns of activity, all within a single, integrated system. Given the complexity of the networks we’re studying, the fact that the technology is also easy to use makes it even more valuable.”
.avif)
Dr. Tetsuya Tanaka
"Our recent data using MaxTwo show that our Mixed Neurons, which are a mixed population of neuron subtypes, fire synchronized bursts within two weeks when co-cultured with human primary astrocytes as detailed in our MaxTwo Application Protocol."
.avif)
Dr. Rouhollah Habibey
“We use the Activity Scan and Network Assay to track the dynamic changes in activity maps of growing networks of human iPSC-derived neurons over time. We found that these changes in activity image match well with dynamics of growing network morphology.”