Beyond Beat Rate: Advanced Cardiac Analysis with MaxLab Live

What does a heartbeat reveal? The new Cardiac Analysis in MaxLab Live 26.1 provides dedicated tools to characterize cardiomyocyte activity, from beat rhythm and regularity to electrical propagation and field potential waveforms. Discover how high-density microelectrode array (HD-MEA) recordings can uncover meaningful functional changes in cardiac models.
Author
Date
Tags
A dedicated analysis to characterize cardiac function
Extracellular signals from cardiomyocytes are fundamentally different from those recorded in neuronal networks. Their large amplitudes, typically regular beating patterns, and coordinated propagation across the tissue provide rich information about cardiac electrophysiology.
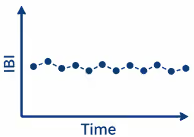
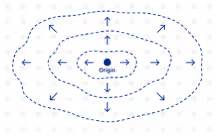
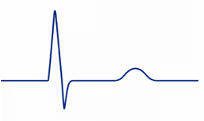
Accordingly, extracting this information requires an analysis tailored to cardiac signals. The new Cardiac Analysis provides dedicated tools to characterize cardiac function across three complementary dimensions:
|
Rhythm and regularity
|
|
Propagation
|
|
Field potential
|
Together, readouts across these categories provide a broader view of cardiac function. Two cardiac models may exhibit similar average beat rates while differing substantially in rhythm regularity, electrical propagation, or field potential waveforms. Characterizing these differences helps researchers investigate disease phenotypes and assess compound effects.
Rhythm and regularity: characterizing cardiac beating
Cardiac rhythm is a key readout in cardiac research and cardiotoxicity studies. While beat rate describes how often a cardiomyocyte culture beats, the regularity of beating is measured by assessing the intervals between consecutive beats. MaxLab Live characterizes both, helping researchers identify changes in beat rate and disruptions such as pauses or premature beats.
Changes in the Interbeat Intervals reveal shifts in rhythm and can flag irregular beating for closer assessment. These can be visualized by showing the Interbeat Interval over time (figure below, top row), where each dot represents the time between consecutive beats. Regular beating appears as a nearly horizontal line, pauses or missed beats produce upward jumps, and changes in beat rate appear as shifts or drifts.
Beat Coverage adds a spatial perspective by showing the percentage of electrodes that detect each beat. The raster plots in the bottom row illustrate how this activity changes over time: each row represents an electrode, and each mark indicates a detected beat. In the rightmost example, the number of detecting electrodes drops sharply within 60 seconds, even though beating continues.
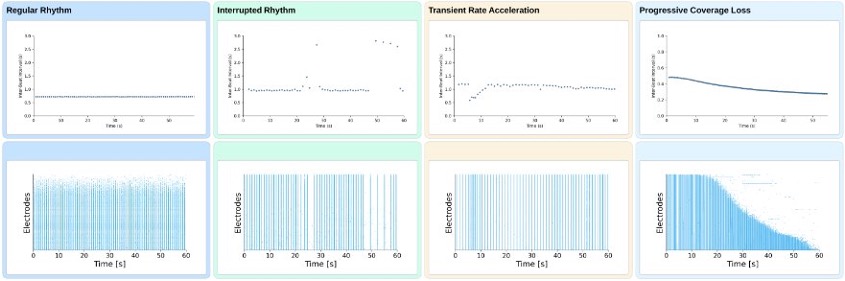
These examples illustrate how rhythm and coverage readouts can be used to measure cardiac activity, helping researchers characterize responses to compound treatment. The next step is to examine where each beat originates and how it spreads across the tissue.
Propagation analysis: mapping how electrical activity spreads
Each beat starts at a specific site and spreads as a wavefront through the electrically coupled tissue. HD-MEAs capture this propagation across thousands of recording sites. MaxLab Live estimates the Beat Origin and Conduction Velocity of detected propagating beats. Comparing these readouts for successive beats reveals how consistently activity originates and spreads across the tissue.
Compound treatment can alter how electrical activity propagates through the tissue, speeding up or slowing down conduction. In the example below, hiPSC-derived cardiomyocytes treated with disopyramide (43 µM), a cardiac sodium-channel blocker, show slower propagation than at baseline. While the displayed beat still originates in a similar region, the wavefront travels noticeably more slowly across the array, reflected in a lower Conduction Velocity.
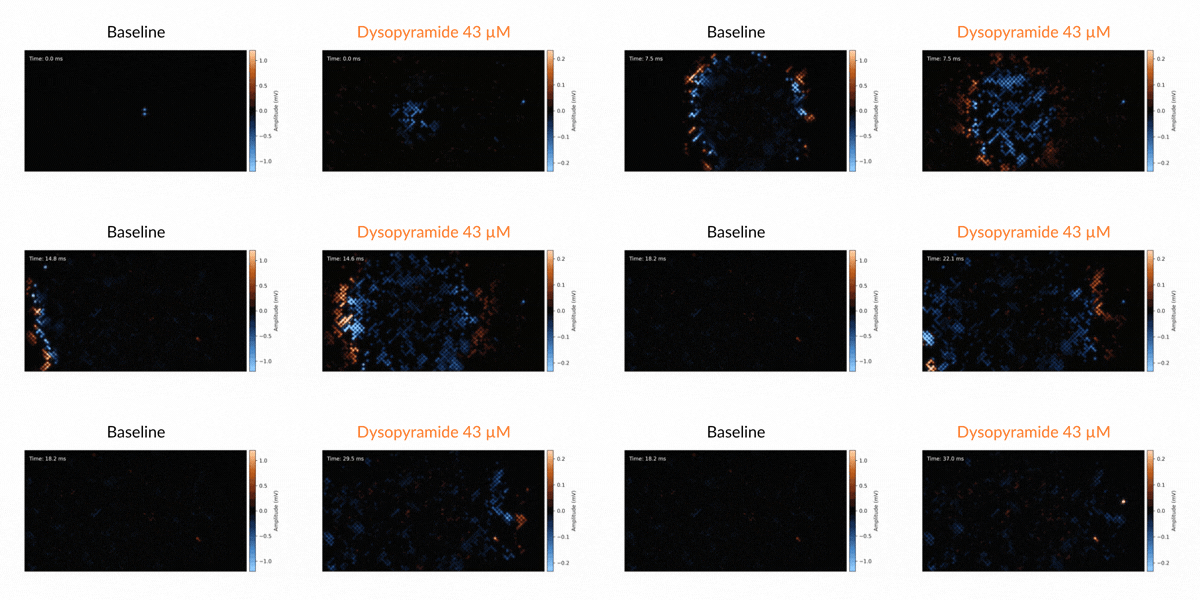
Propagation analysis thus reveals spatial characteristics of cardiac activity that rhythm readouts alone do not capture. To further characterize our cells, we can examine the cardiac field potential waveform itself.
Field potential analysis: investigating the electrical waveform
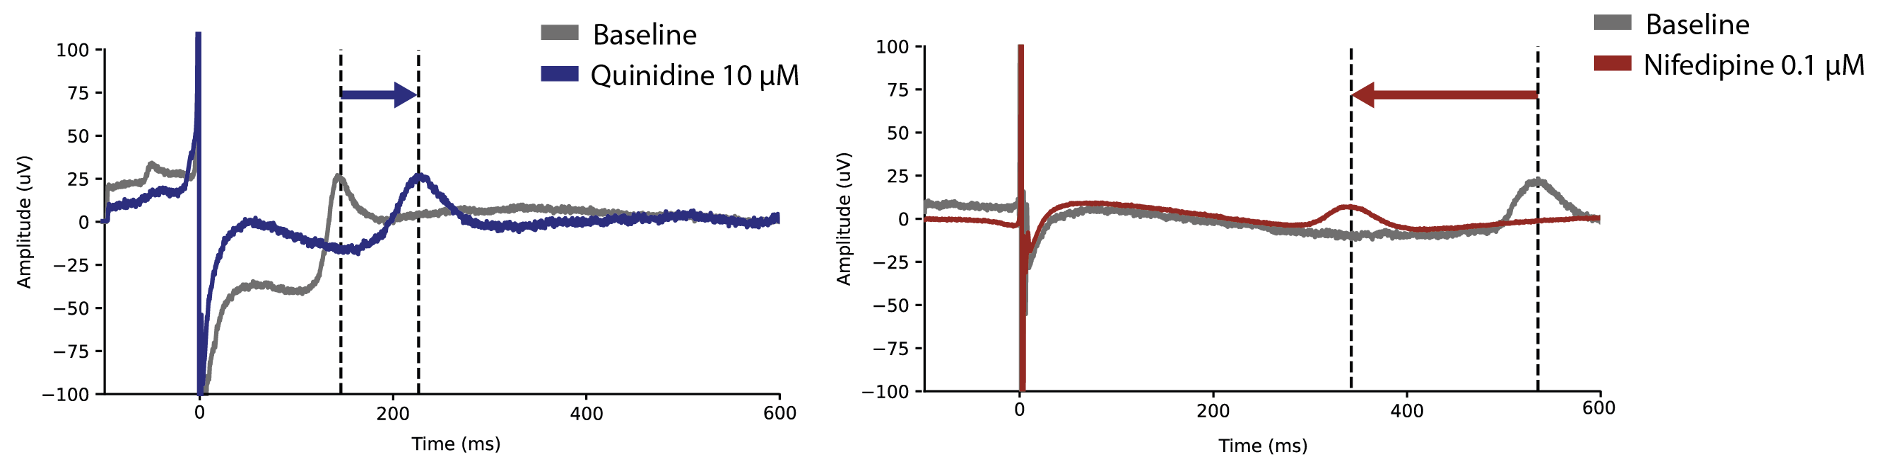
Each beat generates an extracellular field potential that reflects cardiomyocyte depolarization and repolarization. A typical waveform contains a sharp depolarization spike followed by a slower repolarization wave (often termed the T-wave). Changes in the amplitude, shape or timing of these features provide valuable insights into cardiac electrophysiology.
The example field potential waveforms below illustrate changes in repolarization timing after compound treatment. Quinidine shifts the repolarization wave later (left image), whereas nifedipine shifts it earlier (right image). These changes are relevant to cardiac safety studies and should be interpreted alongside beat rate, rhythm regularity, and waveform quality. A shift in repolarization timing alone does not establish proarrhythmic risk.
Automated cardiac analysis across wells and conditions
High-content electrophysiology recordings provide detailed information about cardiac activity. Cardiac Analysis in MaxLab Live 26.1 turns this information into intuitive visualizations and quantitative readouts through a dedicated, automated workflow that combines rhythm, propagation, and field potential analysis. This enables:
- Broader characterization: combine complementary readouts to assess cardiac function and compare experimental conditions.
- Less manual effort: automatically extract more than 23 metrics without tuning analysis parameters.
- Scale across wells: use MaxTwo 6- or 24-well plates to record and analyze multiple experimental conditions in parallel.
For disease modeling, drug discovery, and cardiotoxicity studies, these capabilities help researchers characterize cardiac models and their responses to compounds.
Are you interested in learning how MaxLab Live can support your cardiac research? Book a call with our experts to explore its analysis capabilities.
Related
Resources
MaxLab Live
All-in-one Software

Cardio and others