Cardio and others
Every Cell has a Story to Tell.
Let’s Discover Yours
Electrically active cells play critical roles across many biological systems. Cardiomyocytes and muscle cells, for example, offer powerful in vitro models for investigating excitability, contraction, and tissue-level coordination. Our High-Density Microelectrode Array (HD-MEA) technology captures rich electrophysiological signals at subcellular, single-cell, and network levels, providing precise, label-free insights with unmatched spatial and temporal resolution.
Unbounded possibilities for your model
Adapt our system effortlessly to your biological sample. Capture reproducible, high-quality functional data regardless of your model’s complexity.
Every cell has a story to tell
Explore the behavior of electrically active cells with unmatched single-cell resolution, recording signals from many cells simultaneously to uncover intricate functional profiles.
Always at the right spot
Measure with precision. Record high-quality data with thousands of electrodes per well, perfectly positioned below your cells, ensuring reliable recordings exactly where it matters.
Don’t miss any action potentials
Acquire consistent, high-fidelity action potentials, from the largest to the smallest spikes, and fully characterize both individual cell behavior and population-level dynamics.
Relevant applications:





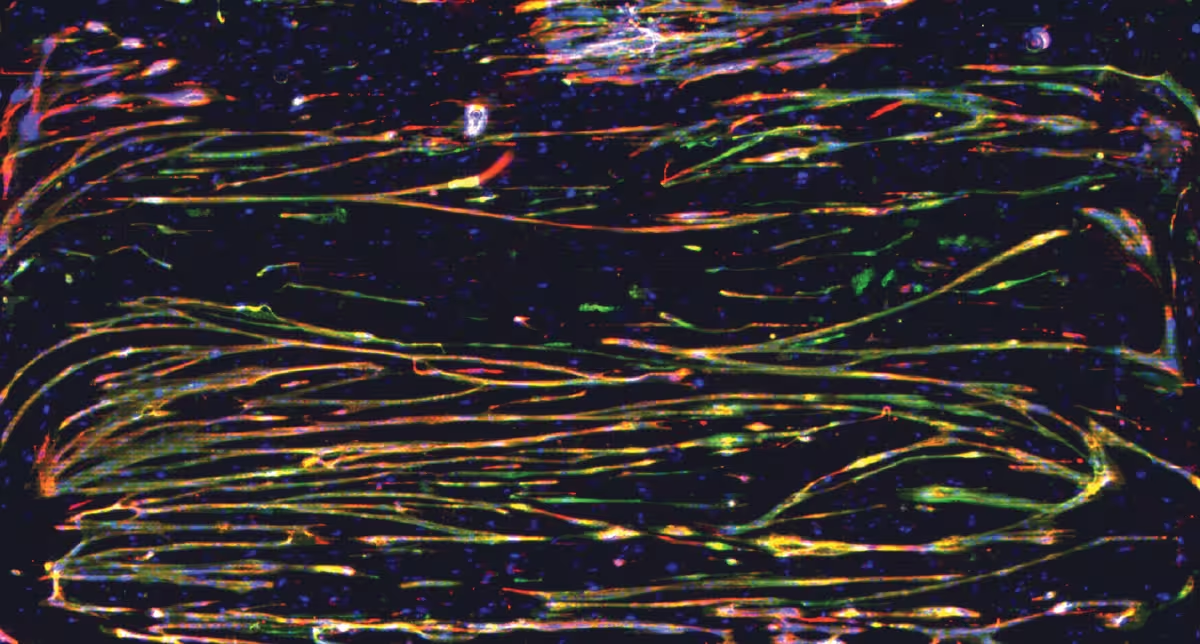
Action potential propagating across an iPSC-cardiomyocyte network, captured by MaxOne HD-MEA.
Case studies

Reveal Disease-Relevant Cardiac Rhythm Phenotypes
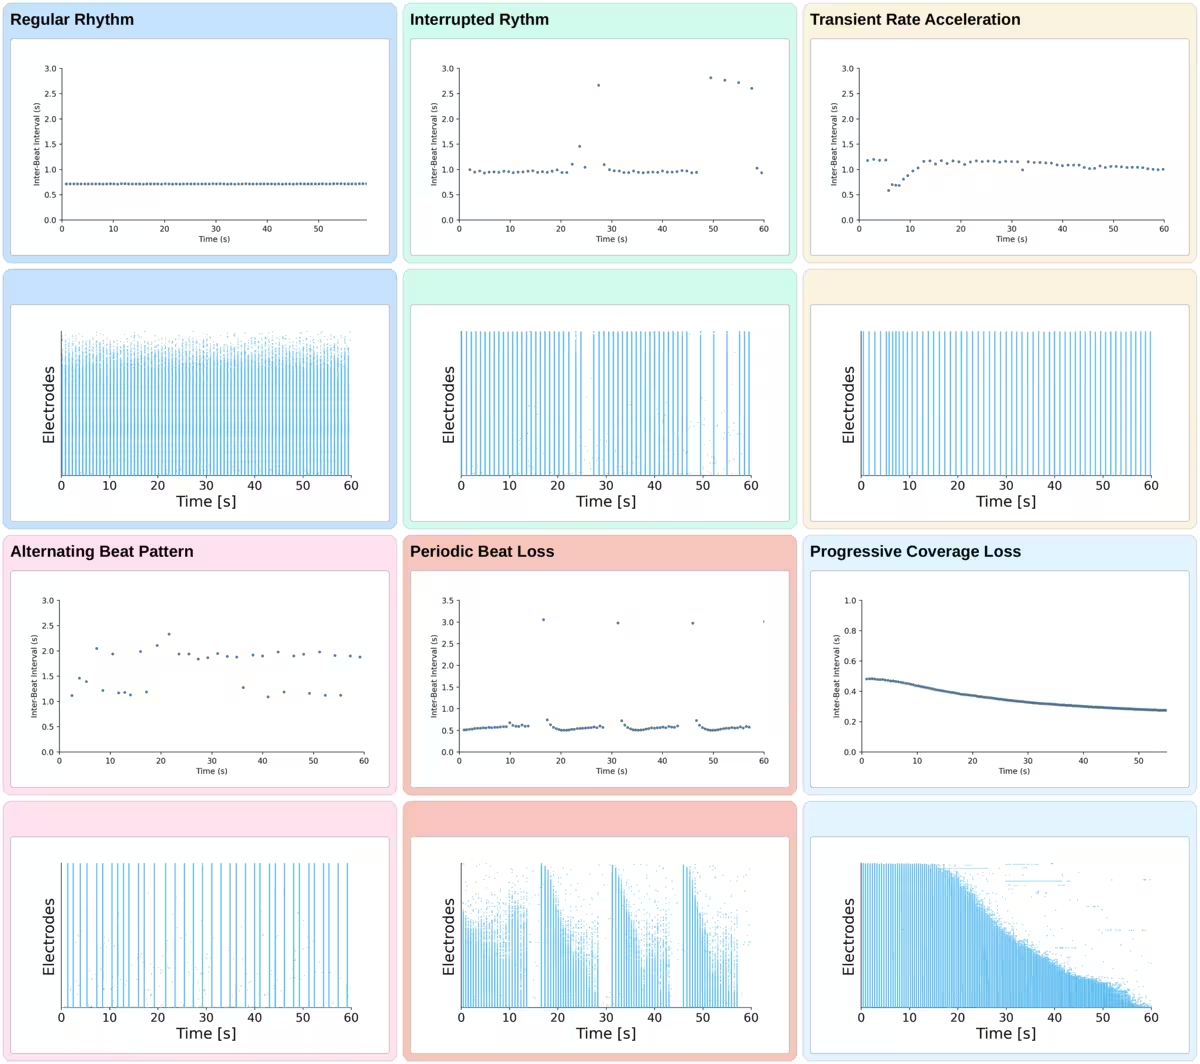
Cardiac dysfunction can manifest through a variety of rhythm patterns, ranging from stable beating to intermittent disruptions in rhythm or transient changes in beat rate. MaxLab Live combines beat detection with intuitive visualizations to rapidly identify and distinguish these characteristic cardiac rhythm profiles. These complementary readouts make complex spontaneous and compound-induced cardiac responses easy to quantify and characterize.

Representative Cardiac Rhythm and Beat-Coverage Profiles
Representative examples of characteristic cardiac rhythm changes. Each profile combines an Interbeat Interval Plot (top) with the corresponding Raster Plot (bottom), providing complementary views of beat timing and spatial activity. Changes in beat coverage, i.e. the spatial extent over which beats are synchronously detected, are reflected in the Raster Plots by the number of electrodes participating in each beat.
Data courtesy of MaxWell Biosystems’ users.
Characterize Drug-Induced Changes in Field Potential Duration
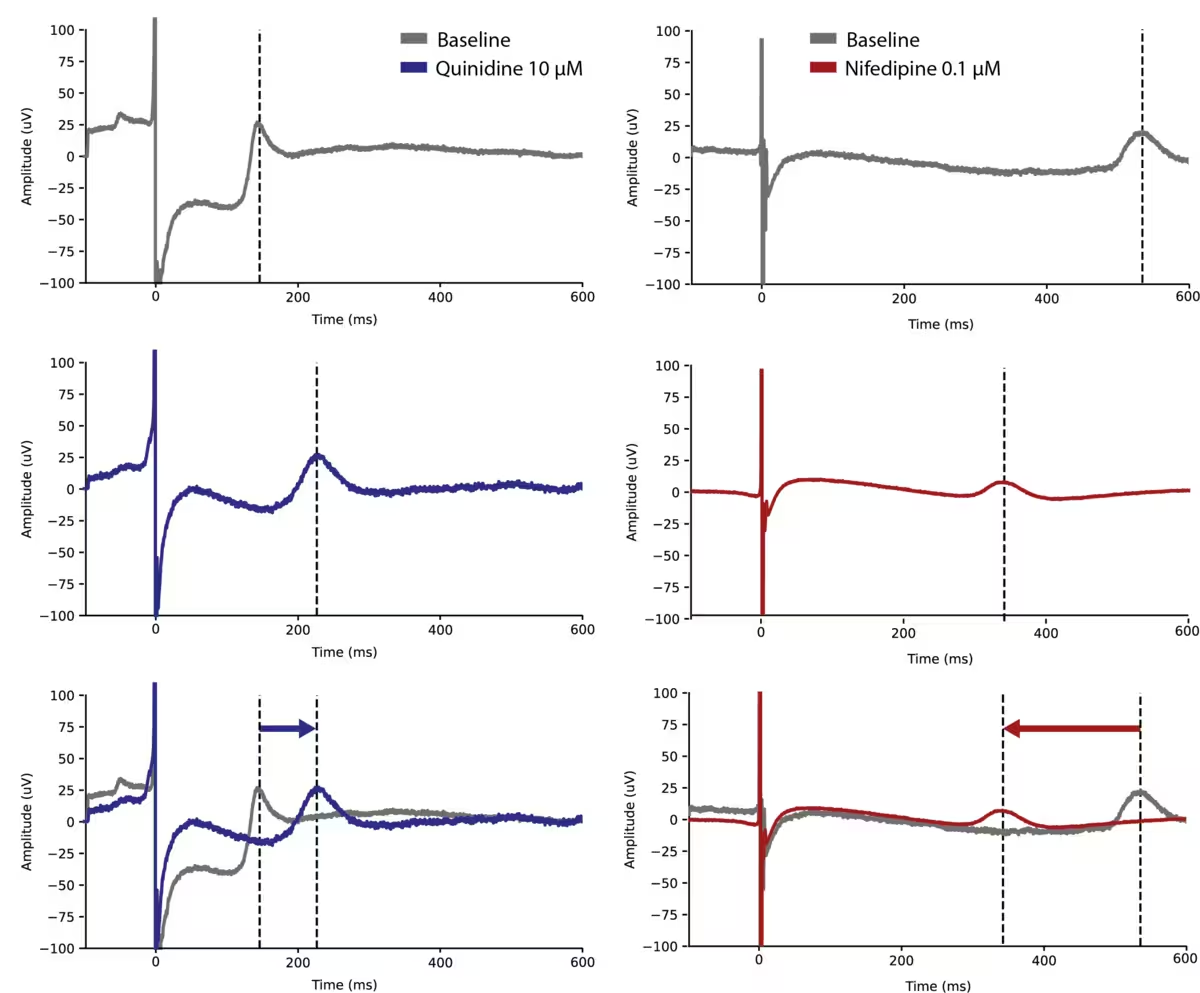
Cardiac repolarization is a key indicator of electrophysiological function and drug safety. Quinidine is an antiarrhythmic drug that prolongs cardiac repolarization, whereas nifedipine is a calcium channel blocker that shortens it. These opposing effects are reflected by changes in Field Potential Duration (FPD), an extracellular surrogate of cardiac repolarization. MaxLab Live automatically detects and visualizes FPD, enabling identification and quantification of compound-induced changes in cardiac repolarization.
Drug-Induced Shifts in Field Potential Duration
Representative field potentials recorded under baseline conditions (gray) and following treatment with quinidine (10 µM, blue) or nifedipine (0.1 µM, red). The highlighted intervals (arrows) indicate the measured Field Potential Duration (FPD) shift relative to the corresponding baseline recording, demonstrating prolongation by quinidine and shortening by nifedipine.
Data courtesy of MaxWell Biosystems’ user.
Map Cardiac Conduction at High Spatial Resolution
Cardiac conduction velocity reflects how rapidly electrical signals propagate through cardiac tissue and is an important readout of excitability, cell-cell coupling, and functional tissue organization. Disopyramide, an antiarrhythmic drug that blocks sodium channels, slows electrical propagation, whereas ranolazine, a late sodium current inhibitor, has little effect on conduction velocity. These examples demonstrate how high-density recordings can be used to visualize and quantify compound-induced changes in cardiac conduction.
Compound-Induced Changes in Cardiac Conduction Velocity
Representative movies of cardiac wave propagation recorded under baseline conditions (left) and after treatment with disopyramide (13 µM) or ranolazine (3 µM) (right). Colors represent R-Spike amplitude, allowing visualization of cardiac wave propagation across the cardiomyocyte culture over time. Disopyramide slows conduction velocity (from 15.0 ± 1.2 to 11.1 ± 0.8 cm/s), whereas ranolazine has minimal effect on conduction velocity (21.7 ± 0.1 vs. 22.5 ± 0.1 cm/s).
Data courtesy of Lee et al. (2024), Frontiers in Physiology, DOI: 10.3389/fphys.2024.1472126, made available under CC BY 4.0.
Tracking electrical maturation in skeletal muscle cultures
Investigate how skeletal muscle cells develop, synchronize, and communicate over time using our HD-MEA technology. The example below shows spontaneous spiking activity recorded at subcellular resolution after one month of culture, highlighting the emergence of organized electrical signaling as myotubes mature into functional, contracting networks.
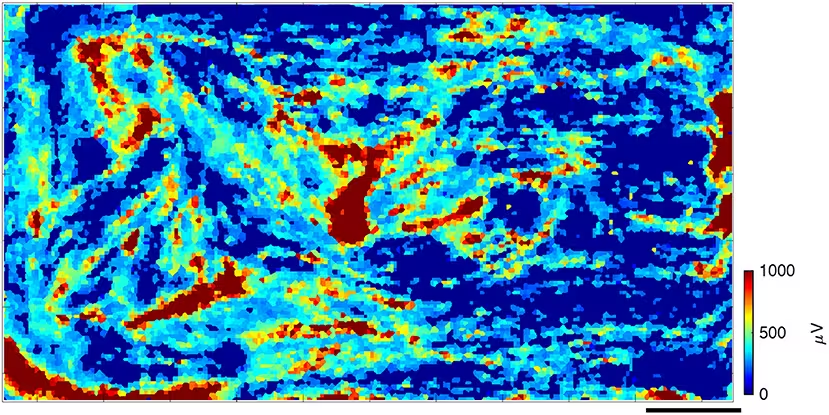
(Top) Spontaneous activity in primary skeletal muscle culture at 30 days in vitro.
Each square in the heatmap represents an individual electrode, color-coded by the average spike amplitude recorded during the session. The red regions indicate areas of high-amplitude spiking, while surrounding lower-amplitude filaments reflect active electrical connections between contracting myotubes. Blue regions denote areas with no detected spiking activity. The spatial heterogeneity and organization of signal amplitudes illustrates tissue maturation and functional compartmentalization. Scale bar: 0.5 mm.
Data adapted from Lewandowska et al., (2018), Frontiers in Physiology, licensed under CC-BY 4.0.
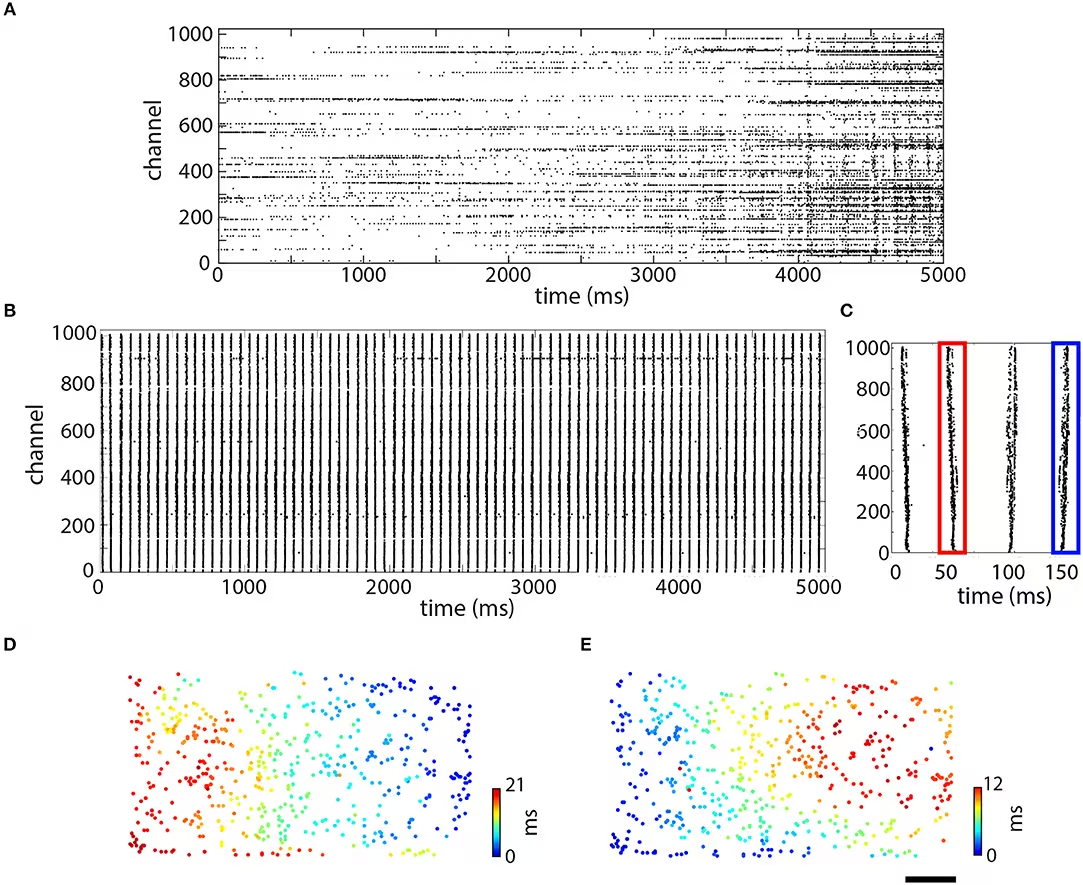
(Bottom) Time- and space-resolved spiking activity in skeletal muscle culture.
(A, B) Raster plots showing 5 seconds of spontaneous activity recorded at 19 and 31 days in vitro (DIV), respectively. Each row represents an individual electrode, and each dot marks a detected spike. (C) Magnified view of the first four spikes from (B). (D, E) Spatially resolved spike timing of the second (red) and fourth (blue) spikes highlighted in (C). Scale bar in (E) is 0.5 mm and applies to (D) and (E).
Data adapted from Lewandowska et al., (2018), Frontiers in Physiology, licensed under CC-BY 4.0.
Selected Resources
Development of an innervated human skin equivalent to model nociceptive circuitry in vitro

CardioMEA: comprehensive data analysis platform for studying cardiac diseases and drug responses

Repeated and On-Demand Intracellular Recordings of Cardiomyocytes Derived from Human-Induced Pluripotent Stem Cells

Long-Term High-Density Extracellular Recordings Enable Studies of Muscle Cell Physiology
MaxOne+ and MaxOne Cardiomyocytes Plating Protocol
This document describes the protocol to plate and maintain cardiomyocytes using MaxOne.

MaxTwo Cardiomyocytes Plating Protocol
This document describes the protocol to plate and maintain cardiomyocytes using MaxTwo 6 and 24-Well plates.