Profiling Network Bursts and Revealing Phenotypes with MaxLab Live

Microelectrode arrays have long captured the rhythms of neuronal networks.
Now, MaxLab Live 26.1 takes it to the next level, revealing how their bursts unfold.. Building on high-density, low-noise electrophysiology recordings, the new Burst Shape Metrics characterize how network activity rises, peaks, and decays, revealing subtle differences in neuronal maturation and compound responses that conventional burst metrics may miss.
Author
Date
Tags
From single neurons to networks
For much of the history of cellular electrophysiology, recording meant listening to one neuron at a time. Sharp electrodes and patch pipettes revealed cellular activity but typically captured only one or a few cells at once. More than 50 years ago, the first microelectrode arrays (MEAs) opened a new perspective. By integrating an array of electrodes into a culture substrate, Thomas and colleagues (1972) recorded electrical activity from cultured heart cells at multiple sites. Gross and colleagues (1977) developed the approach for neuronal recordings, and Pine (1980) demonstrated recordings from cultured neurons.
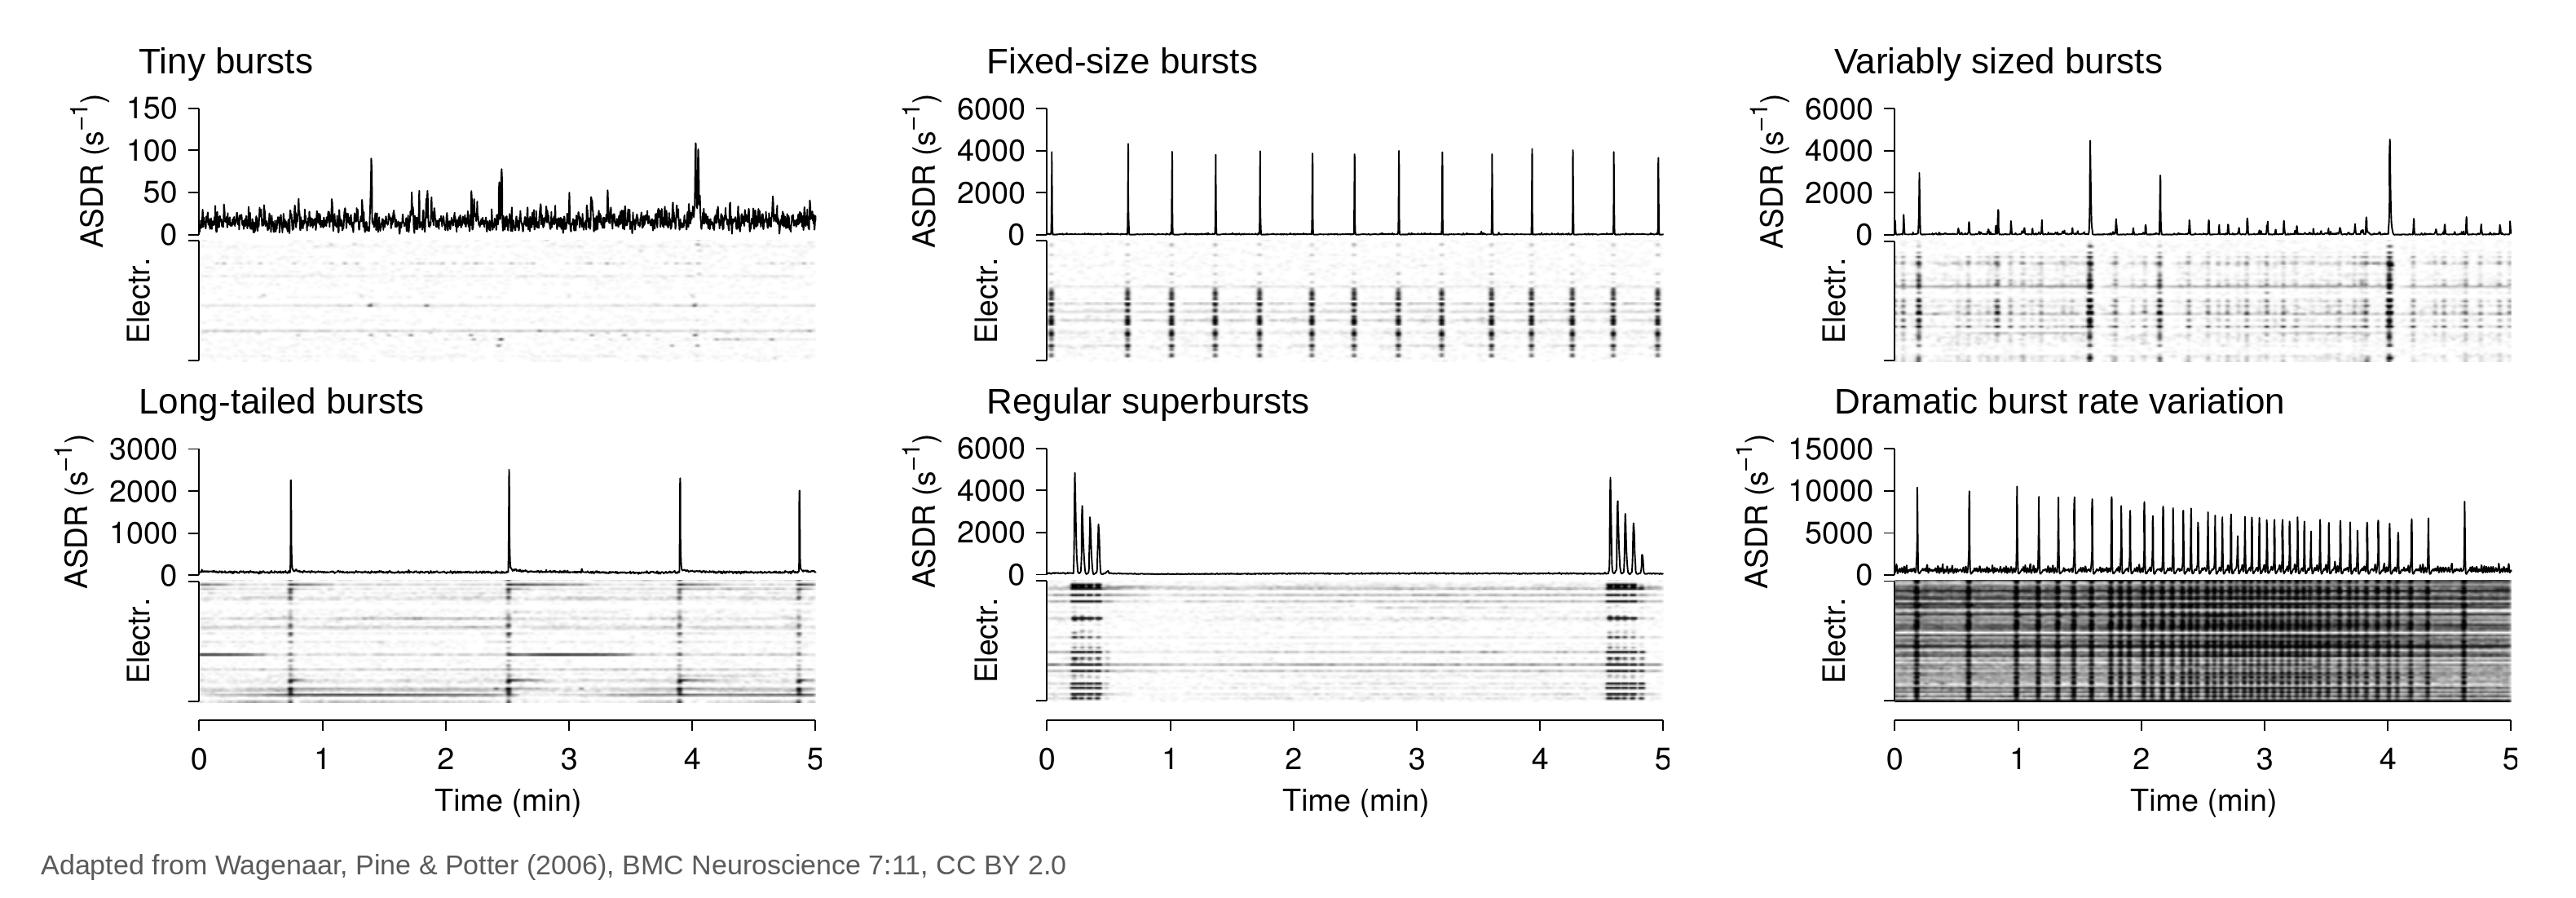
The real advance was not simply more recording sites. It was a broader view of activity across the network. Neurons in culture connect, communicate, and organize into coordinated activity, and MEAs made it possible to measure this activity across many cells simultaneously. One of the most prominent patterns they revealed is network bursting: brief periods of elevated, coordinated firing across many neurons (Figure 1). Bursting patterns change as cultures mature (Wagenaar et al., 2006) and are shaped by neuronal connections and the interplay between excitation and inhibition, making them one of the key readouts of neuronal network function in vitro.
Capturing network burst profiles at full precision
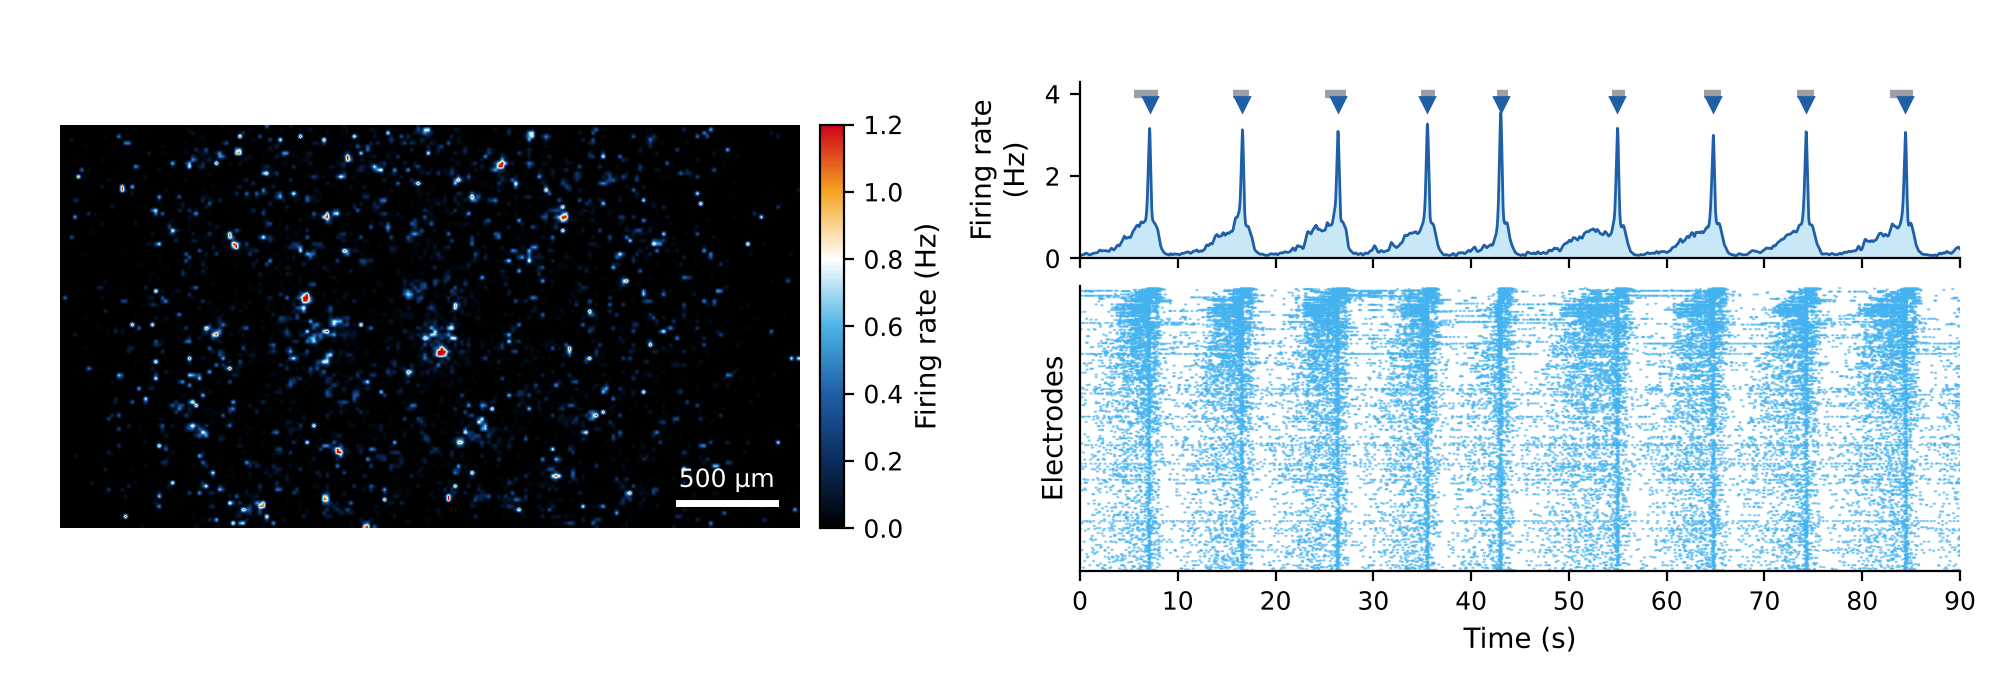
High-density MEAs (HD-MEAs) took the next step: , Beyond resolving individual neurons, HD-MEAs capture activity across the entire neuronal network simultaneously. With tens of thousands of electrodes per well, there is no need to hope active cells land close to the electrodes; you scan first, then focus on the sites that matter (see Why flexibility matters in HD-MEA recordings).
In MaxLab Live, the Network Assay automatically selects electrodes across the entire sample, so each recording captures high-quality signals from neurons throughout the full network. As a result, the profile of each network burst can be measured in full detail.
Burst shape metrics: reveal how a burst unfolds
How quickly neuronal activity rises, how strongly it peaks, and how rapidly it declines together define the shape of a network burst. Even when two conditions show similar burst frequencies and durations, specific burst phases may differ, revealing physiologically meaningful differences in how networks generate, sustain, and terminate coordinated activity.
For every detected network burst, MaxLab Live 26.1 computes different burst shape metrics (Figure 3). They capture the rise (Rise Time, Rise Slope, Onset Sharpness), the width (Full Width at Half Maximum), the decay (Decay Time, Decay Slope), and the overall structure of each burst (Asymmetry Index, Number of Subpeaks).
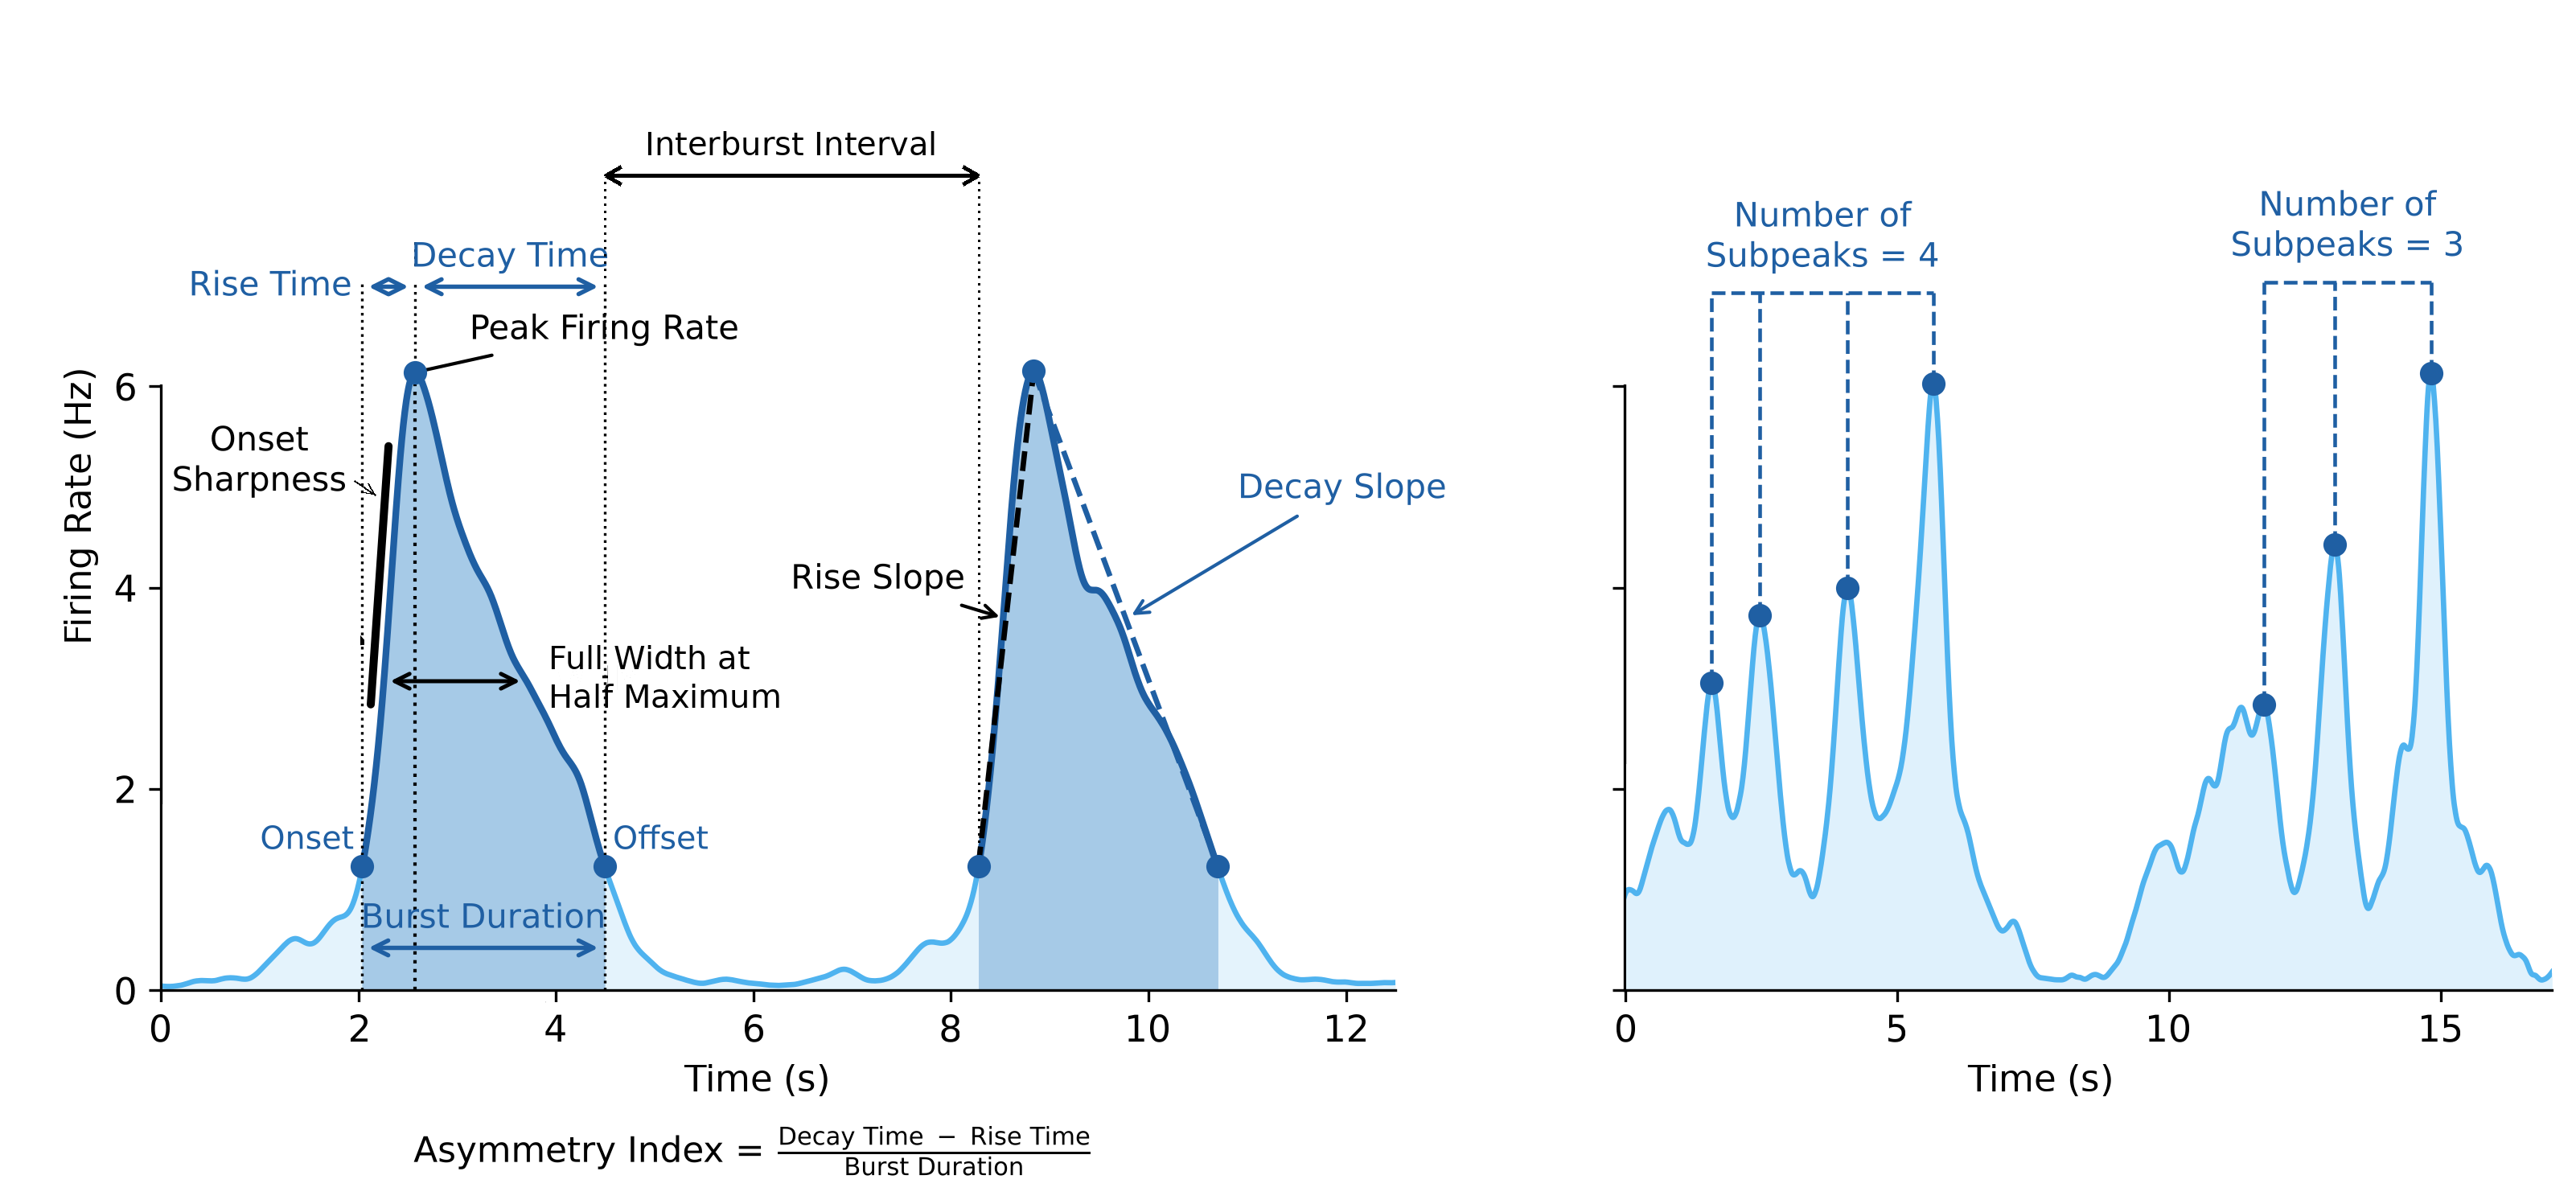
Table 1: Selected burst shape metrics:
Together, these metrics turn each burst into a detailed fingerprint of network behavior, making it possible to distinguish samples that look identical by burst rate and duration alone.
Culture medium shapes coordinated recruitment and termination dynamics
Culture conditions shape neuronal networks maturation, and burst shape captures this in detail. Together with Thermo Fisher Scientific, primary rat cortical neurons were cultured in Neurobasal PhysioPlus or Neurobasal Medium and longitudinally recorded on the MaxTwo 24-Well Plate (DIV 14-30). PhysioPlus cultures established a consistent burst shape phenotype earlier: Full Width at Half Maximum and Asymmetry Index remained stable throughout development, whereas Neurobasal cultures started with broader, more asymmetric bursts that narrowed only over time (Figure 4).
At the same time, Onset Sharpness and Decay Slope kept increasing in PhysioPlus. Network recruitment and termination became progressively more abrupt as the networks matured, even though the overall burst profile was set early.

Distinct compound-induced changes in burst dynamics
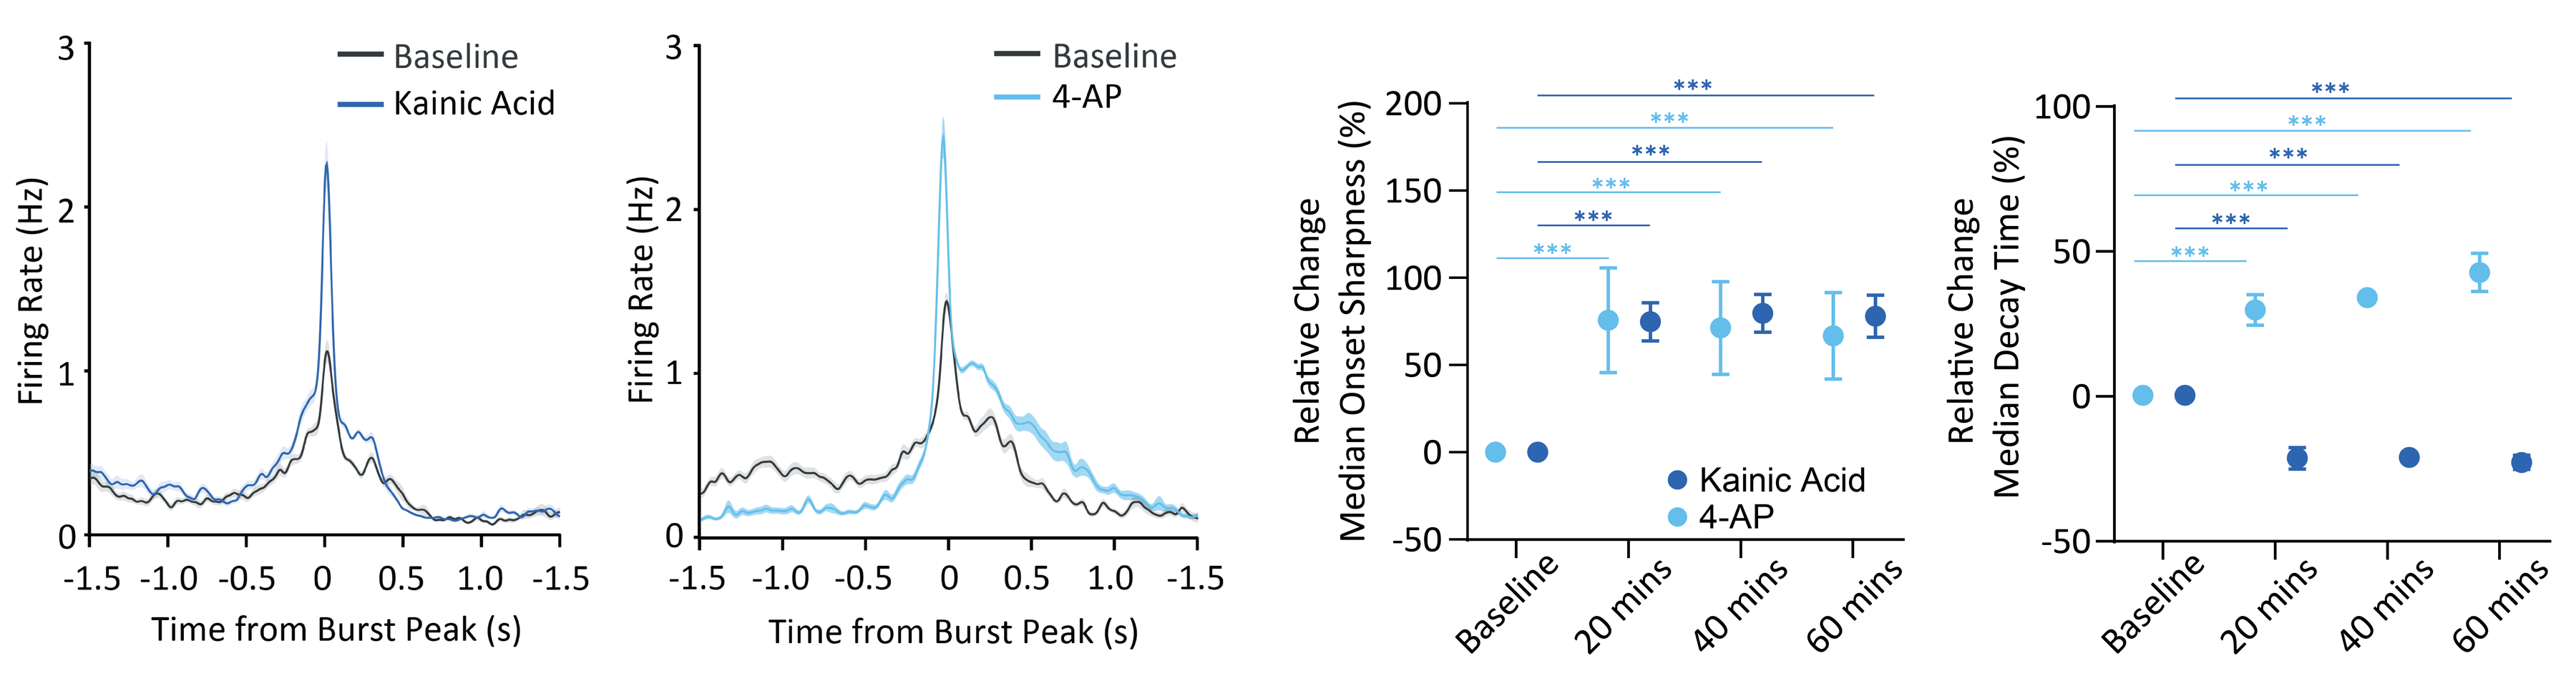
Burst shape also distinguishes compounds by how they act. In InSphero 3D InSight Human Neural Microtissues, kainic acid (10 µM) and 4-AP (30 µM) both increased burst frequency, consistent with enhanced network excitability. Burst shape revealed that they get there in different ways (Figure 5).
Both compounds increased peak firing rates and Onset Sharpness, indicating a stronger, more abrupt rise in network activity, consistent with enhanced glutamatergic excitatory drive for kainic acid and increased neuronal excitability for 4-AP. However, their post-peak dynamics differed markedly. 4-AP consistently prolonged the decay phase, consistent with sustained network reverberation following potassium-channel blockade, whereas kainic acid shortened Decay Time, leading to a faster decline in network activity. Compounds with similar effects on burst rate thus leave distinct shape signatures that point to their mechanism of action.
Don't just count bursts. Profile them.
For more than 50 years, MEAs have shown that neuronal networks burst. MaxLab Live 26.1 shows how. Burst shape metrics are part of the Network Burst Analysis and are calculated automatically for every recording, including the ones already on your drive.
Are you interested in learning how MaxLab Live can support your network research?
References
- Thomas CA et al. (1972), Exp Cell Res – first MEA recordings from cultured cells.
- Gross GW et al. (1977) and Pine J (1980), J Neurosci Methods – first MEA recordings from neurons.
- Wagenaar DA, Pine J, Potter SM (2006), BMC Neuroscience 7:11, CC BY 2.0.
- Why flexibility matters in HD-MEA recordings (Ed Li, MaxWell Biosystems).
- MaxWell Biosystems’ application notes in collaboration with Thermo Fisher Scientific and InSphero.
Related
Resources
MaxLab Live
All-in-one Software

Our Technology
Multi-/Micro-electrode Arrays